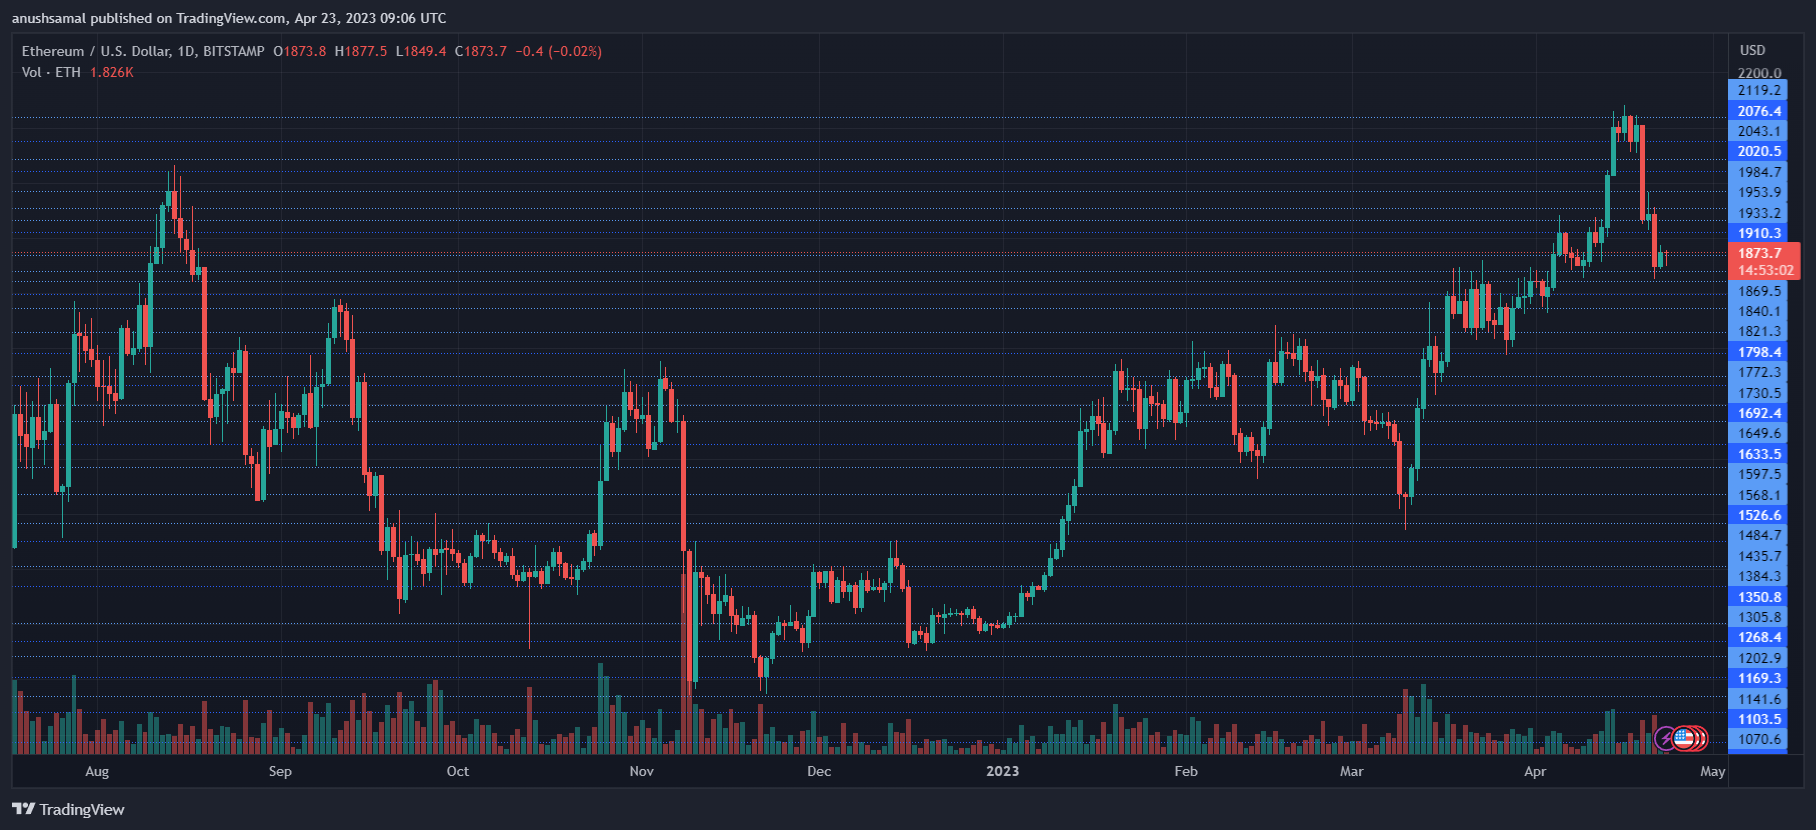
The price of Ethereum has fallen below $1,900, dropping from the $2,000 mark that was previously held by bulls. This has led to another sell-off and the bearish influence remains strong despite attempts at recovery.
In the last 24 hours, Ethereum has risen by only 1.2%, but on the weekly chart, the altcoin has seen a significant drop of over 10%. The technical outlook for Ethereum is also in favor of the bears, as demand and accumulation for the altcoin have decreased. In order for Ethereum to make a recovery, it is crucial for it to breach the immediate resistance strength from buyers.
Despite this, most altcoins, including Ethereum, have remained bullish on the higher time-frame structure. However, bulls must defend the following support line or supply zone for Ethereum to start its recovery.
With Bitcoin struggling under the $30,000 price mark, many altcoins are also experiencing difficulty in breaking through their immediate price ceilings. On the one-day chart, the decline in the market capitalization of Ethereum indicates a decrease in buyers.
Ethereum Price Analysis: One-Day Chart

At the time of writing, ETH was valued at $1,880, having fallen below its bearish block ranging from $1,900 to $2,000. This drop in price is likely due to a routine price pullback, as Ethereum had traded above the $2,025 price mark after approximately eight months. However, as selling pressure increased, the bears have taken control.
The immediate overhead resistance for the altcoin is $1,910. A move above this level could potentially push ETH to touch $1,950, which may help to facilitate a price recovery. Conversely, the support levels for ETH are currently at $1,840 and $1,820.
During the previous session, the amount of ETH traded was in the red, indicating an increase in selling pressure.
Technical Analysis

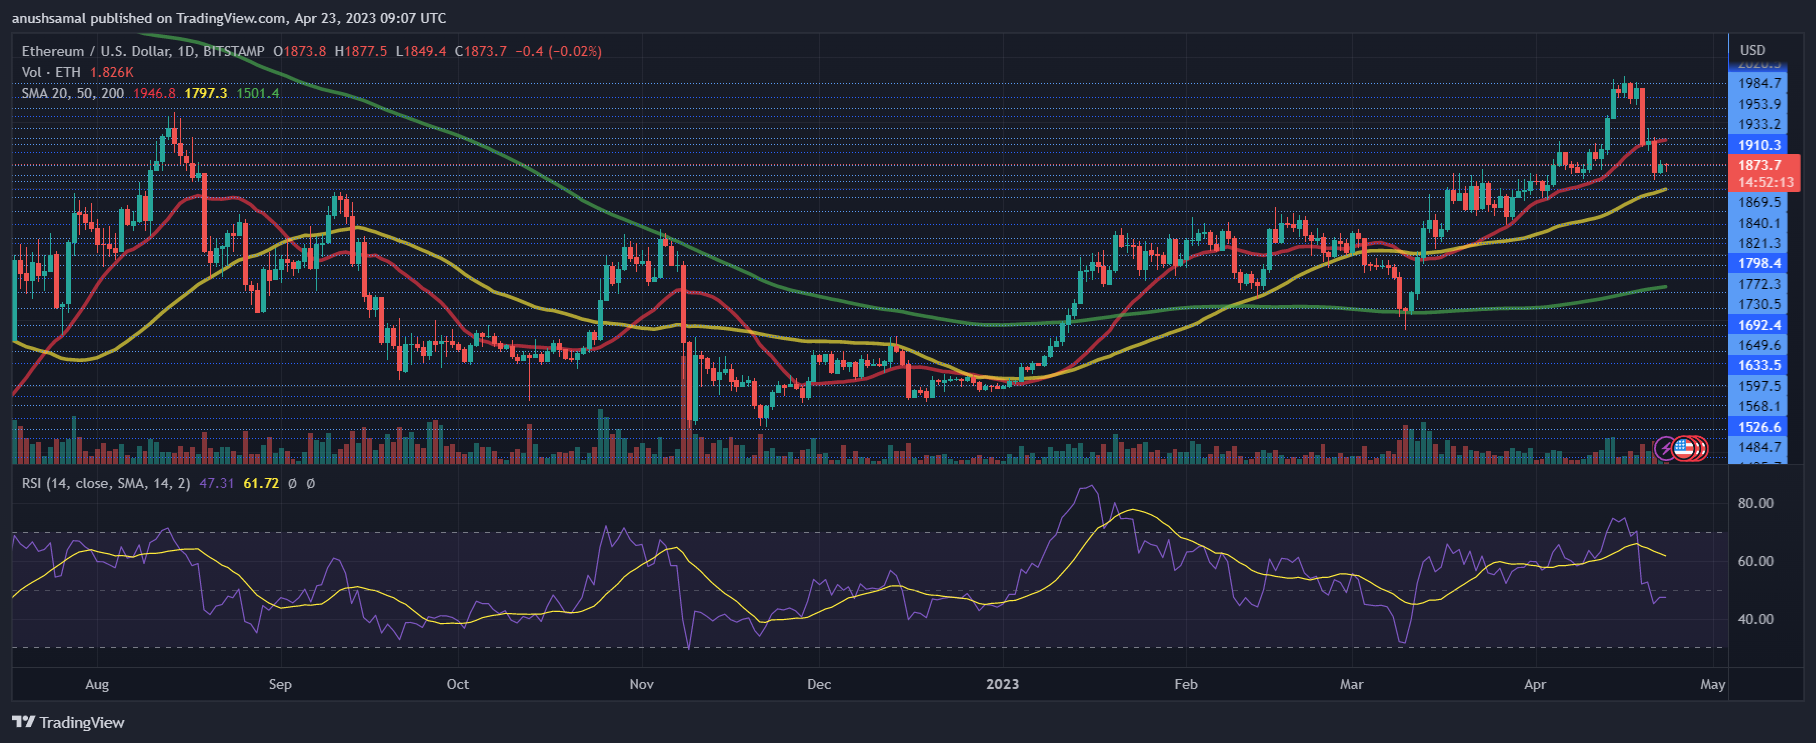
As demand for ETH decreased, buyers also began to lose confidence in the asset. The Relative Strength Index showed that sellers outnumbered buyers on the one-day chart, as it was positioned just below the 50-mark.
Additionally, ETH dropped below the 20-Simple Moving Average line, indicating that sellers were in control and driving the price momentum in the market. However, with a slight increase in demand, ETH has the potential to trade above the 20-SMA line once again.

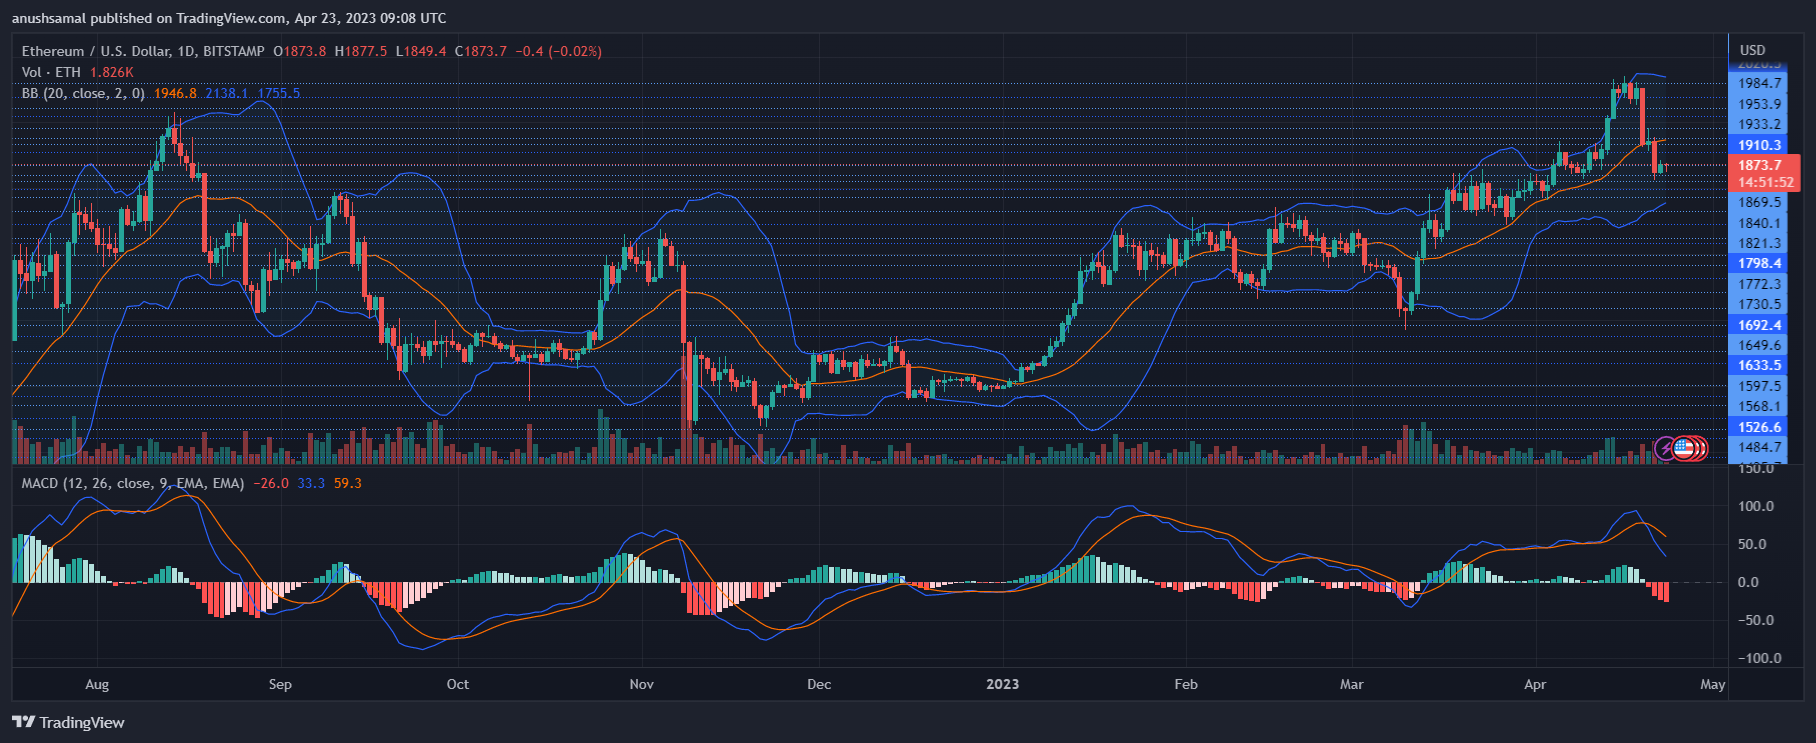
In line with other technical indicators, ETH began to exhibit sell signals on the one-day chart. The Moving Average Convergence Divergence, which measures price momentum and reversals, formed red histograms. This reading corresponds to sell signals for the altcoin.
Additionally, the Bollinger Bands, which gauge price volatility, were relatively far apart, but they have started to slightly converge. It suggested that ETH may trade within a specific price range over the coming trading sessions.
Featured Image From UnSplash, Charts From TradingView.com
#Whats #Ethereum #Price #Drops


Add a Comment